IPUMS PMA Survey Notes
Survey Types
IPUMS PMA comprises several different type of surveys, collected by the same organization and using similar data collection techniques. A basic understanding of the structure and characteristics of each survey is essential for leveraging these data well. Below are descriptions of each file found on the IPUMS PMA online data dissemination system.
- Household and Female
- Service Delivery Point
- Maternal and Newborn Health
- Nutrition
- COVID-19
- Client Exit Interview
- Longitudinal Family Planning Panel
- Longitudinal Service Delivery Point
Household and Female surveys
The core of IPUMS PMA are the household and female surveys conducted by Performance Monitoring for Action (PMA) in 11 countries since 2013. These are cross-sectional surveys of sampled households and women of childbearing age (15 to 49) who reside in the household. The household respondent provides information about the wealth, water sources, sanitation facilities, and other housing characteristics. The female interview includes questions about family planning use, fertility preferences, fertility history, and other topics.
Data file structure: Each record is a person within a household. Women of childbearing age have household characteristics attached to their record. These files include nonrespondents to both the household questionnaire and female questionnaire. By default, the online dissemination system selects only female respondents, but users may choose to include household members and/or nonrespondents in their data extracts.
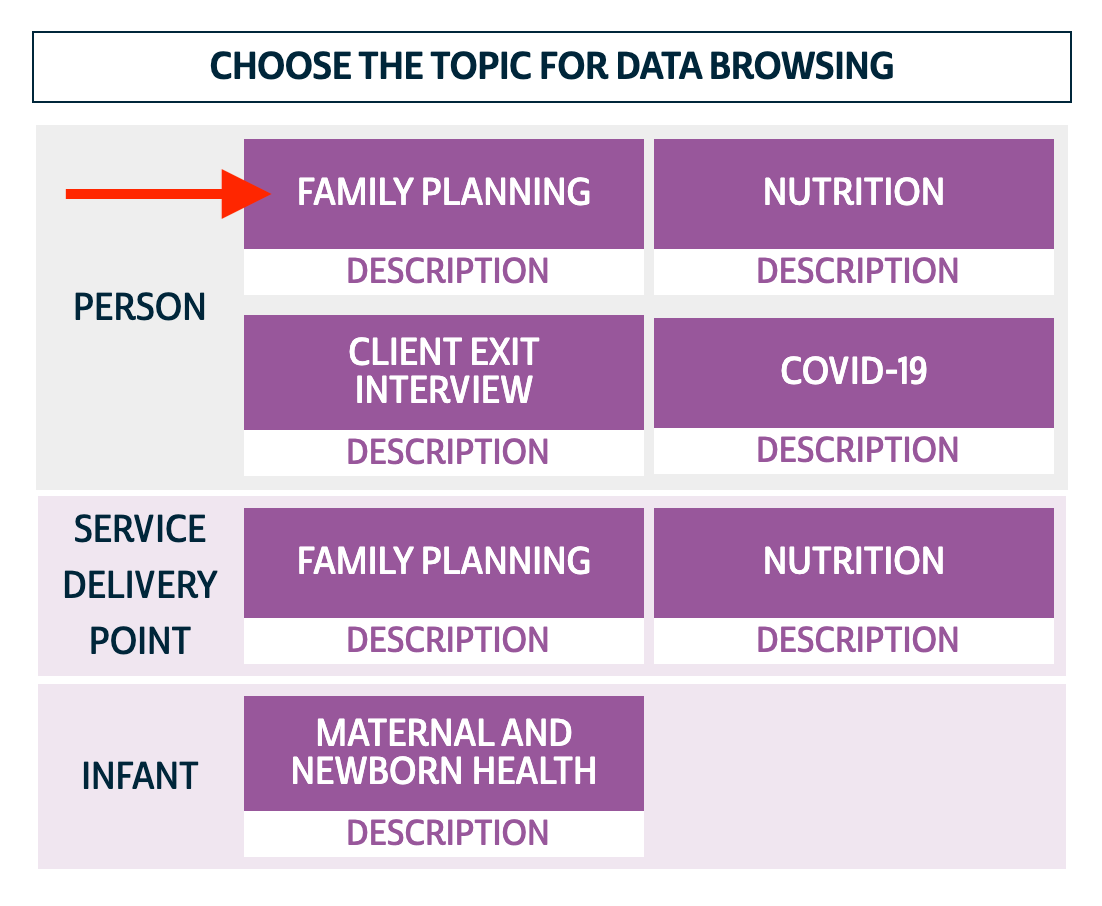
How to get these data: On the online data dissemination system, choose the Family Planning - Person unit of analysis.
Service Delivery Point (SDP) surveys
In parallel with the Household and Female surveys, enumerators interviewed a knowledgeable staff person at up to 3 public and up to 3 private health facilities in the same enumeration areas (EAID) as the household and female surveys in the same years. This allows researchers to use microdata to describe the service delivery environment in which the women live. See our user note on how to use SDP data with household and female data.
Data file structure: Each record is a health facility. In order to use these data with the household and female files, researchers need to calculate summary statistics at the EAID level and merge to a household and female file of the same country(ies) and round(s).
How to get these data: On the online data dissemination system, choose the Family Planning - Service Delivery Point unit of analysis.
Maternal and Newborn Health
In Ethiopia, PMA has collected panel data on maternal and newborn health in separate cohorts, and the survey design has changed over time. For all cohorts, each record is an infant (both live and stillbirth). There are several cases of twins, in which case the attributes of the mother and the household are attached on each infant's record. Therefore, in each file, mothers of twins will be represented twice.
How to get these data: On the online data dissemination system, choose the Infant unit of analysis.
Data from the 2016-2017 cohort does not provide separate records for household members. Note that there are a small number of cases of households with more than one pregnant women. These households are therefore represented more than once.
Data from the 2019-2021 and 2021-2023 cohorts include separate records for household members and the women who are part of the longitudinal panel. IPUMS has adjusted the data format such that each non-household member record is an infant (both live and stillbirth), or a panel member woman if the pregnancy ended in miscarriage or abortion.
2016-2017 Cohort
Enumerators conducted household roster surveys of all households in sampled enumeration areas to find households with pregnant women in the Southern Nations, Nationalities, and People's region of Ethiopia. Then, a female screening survey was conducted for each pregnant woman. Enumerators followed up in person at 7 days and 6 weeks after the woman's delivery, and then either by phone or in person at 6 months after delivery.
2019-2021 Cohort
The longitudinal panel on women and infants was selected simultaneously with the 2019 Ethiopia Household and Female cross-sectional data sample on family planning on reproductive health. Women who were pregnant were asked whether they consented to participate in the panel and were asked baseline interview questions about the pregnancy, antenatal care, family planning, and other topics. Women who were up to 9 weeks postpartum at baseline were asked baseline and 6-week follow-up questions in the same interview. Enumerators then returned to interview women who had been pregnant at baseline for a 6-week follow-up. All women were then interviewed at approximately six months and one year post-partum.
The 6-week and 6-month follow-up questionnaires each have a pre- and post-COVID version. The variables SURVEYVERSION_6W and SURVEYVERSION_6M indicate whether the woman received the original or revised questionnaire version. The revised version included questions about whether COVID restrictions impacted their ability to receive post natal health care or vaccinations, changed the planned location of delivery, and other questions about how COVID affected them.
2021-2023 Cohort
Another longitudinal panel on women and infants was selected from the 2021 Ethiopia Household and Female cross-sectional data sample on family planning and reproductive health. The topical content of this panel as well as its structure replicate those of the 2019-2021 cohort detailed above, except for the pre- and post-COVID versioning which has been removed for the 2021-2023 cohort.
Nutrition
In 2017 and 2018, PMA conducted Nutrition surveys in Burkina Faso and Kenya, at both the person level and at the service delivery point level.
Household and Female
Data file structure: Each record is a person within a household. Enumerators collected household roster information from randomly selected households from sampled Enumeration Areas (EAs).
Round 1 (2017)
Households were eligible for the household survey if there was at least one female aged 10 to 49 and at least one child under age 2 living in the household. Females aged 10 to 49 were eligible for the female survey if they lived in a household with a child under the age of 2. Children under the age of 5 living in a household with a child under the age of 2 and a female aged 10 to 49 were eligible for the female-child nutrition survey. The female aged 10 to 49 answered the survey for the child under 5.
Depending on the child's age and other factors, each child was eligible for a different set of nutrition questions:
See the variable ELIGTYPE for more details. Users should note that children under 2 who were not the youngest child in the care of the female aged 10-49 were not eligible for the nutrition questionnaire.
The original data was disseminated in three files - the household roster, female survey, and children nutrition survey. IPUMS restructured these data into a single data file using the following steps:
- Attached data from the female survey onto each of the women's records on the household roster using a individual female ID number (FCQINSTID) provided in the original data.
- Characteristics from the female's record was merged onto the child's record also using the female ID number, which represented the mother or caretaker of the child.
- Using children's birth month, birth year, and household identifier, the data from the child survey was attached to the corresponding record of the child in the household roster. This step is important because the child's gender was on the household roster, but not the Child file.
- Attached household level characteristics (water sources, wealth, etc) to children from the Child file that were not matched to records in the household roster.
- PMA had also constructed records for children who had died, according to the responses from the female-child survey. These records contained the birth year and death year of the child. IPUMS attached this data to the woman's record and omitted the records of the deceased children from the file.
Round 2 (2018)
All households were eligible for the household survey. All children under age 5 were eligible for the child survey. The primary caretaker of the child answered the questions for the child. Twenty-five percent of the households surveyed (see variable FQSELECTED) for the household roster were randomly selected for the female survey, even if a female aged 10 to 49 was not a part of the household. Females age 10 to 49 in these selected households were eligible to respond to the female survey. The data in this round were disseminated in one file per country. Unlike Round 1, the mother or caretaker's identification number is not present on the child record, so it is not possible to attach mother's characteristics onto the child's record.
How to get these data: On the data dissemination system, choose the Person - Nutrition unit of analysis.
Service Delivery Point
Data file structure: Each record is a health facility. In order to use these data with the household and female files, researchers need to calculate summary statistics at the EAID level and merge to the Nutrition household and female file of the same country and round by EAID. See our memo about using household and service delivery point (SDP) data together.
How to get these data: On the data dissemination system, choose the Service Delivery Point - Nutrition unit of analysis.
COVID-19 surveys
The PMA COVID-19 survey is a follow-up telephone survey administered to women who participated in an in-person baseline survey for a broader panel study. This baseline survey was collected between November 2019 and Februrary 2020 - prior to the appearance of COVID-19 in most countries.
When the outbreak of COVID-19 grew into a global pandemic in the spring of 2020, PMA representatives partnered with the Ministries of Health in DRC, Kenya, Burkina Faso, and Nigeria to design a shorter - approximately 30 minute - survey responding directly to the effect of COVID-19 on women and their households.
Women were selected for the baseline survey if they were age 15-49 and resided in a household screened at random from a sample cluster represented by EAID. All women surveyed at baseline where eligible to participate in the COVID-19 follow-up, provided that they 1) agreed to the interview, and 2) owned or had access to a telephone.
You'll find survey weights adjusted for the probability that a given woman had access to a telephone recorded in the new variable CVQWEIGHT. This weight is normalized for the target population of each sample (note that two of the samples are not nationally representative):
- Burkina Faso: nationally representative
- Kenya: nationally representative
- DRC: Kinshasa only
- Nigeria: Lagos and Kano only
You'll find more detail about the construction of PMA COVID-19 survey weights here. For information about response rates for each sample, check out sample-specific Dataset Notes.
To link female records between the baseline surveys and the COVID-19 surveys, drop household members who are not eligible women (use CONSENTFQ) and merge by FQINSTID. If you are using Stata, use the following code to trim trailing zeros and change the format of FQINSTID in order to merge:
recast str50 fqinstid
replace fqinstid = trim(fqinstid)
Client Exit Interviews
The client exit interview surveys were introduced in 2019 in select countries. Interviewers approached women leaving family planning clinics to ask about the services they received during their visit. Only women aged 15-49 were eligible to be interviewed, and are only interviewed once in a sample. Most questions on the survey were only given to women who had received either information on family planning or a method. Questions include whether the woman received her preferred method, whether advantages or disadvantages of certain methods were discussed, and how the visit experience was (length wait time, polite staff, etc).
The sampling frame for client exit interviews begins with the random sampling of primary sampling units called EAs, which are small geographic areas of about 200-300 households. Households are sampled from these EAs for the household and female family planning surveys, and up to three public and three private health facilities in these areas are also visited for the service delivery point surveys. A subset of these facilities that provide family planning services were chosen if they reached a certain threshold of clients per day, and interviewers approached women who left the facility after an appointment to complete a client exit interview.
The data in the client exit interviews can be attached to the service delivery point (SDP) data in the same year and country using the variable FACILITYID. For some countries, there is a follow up survey for the respondents within a 6 month period. Pre-linked longitudinal data for client exit interview follow-ups can be accessed by choosing the Client Exit Interview unit of analysis, and by choosing "Longitudinal" when selecting samples.
How to get these data: On the data dissemination system, choose the Person - Client Exit Interview unit of analysis. The default case selection is for women aged 15-49. When selecting All Cases, you include observations of women who were not eligible for interview.Longitudinal Family Planning Panel
The initial survey design of Performance Monitoring for Action was a high-frequency, cross-sectional survey on family planning, water, and sanitation indicators. Beginning in 2019, PMA refocused on reproductive and sexual health indicators, and adjusted the survey design to add a contraceptive calendar and a longitudinal panel of women of childbearing age to observe contraceptive and fertility dynamics.
Burkina Faso, Kenya, Nigeria, and the Democratic Republic of the Congo began fielding their baseline panel survey in 2019. Baseline surveys for Cote d'Ivoire, Uganda, and India were fielded in 2020. PMA refers to the panel in terms of phases. Phase 1 is the baseline sample, Phase 2 is the first follow-up, and Phase 3 is the last follow-up. Each phase is around one year apart.
Data file structure: See our guide on longitudinal data file structures.
How to get these data: Navigate to our online data dissemination system and choose the Family Planning topic under the Person unit of analysis. Then click on "Select Samples". You will now have the ability to view either the cross-sectional samples or the longitudinal samples using radio button selections.
See our tutorial video on the longitudinal data for more details on how to access cross sectional or panel data from the online data dissemination system.
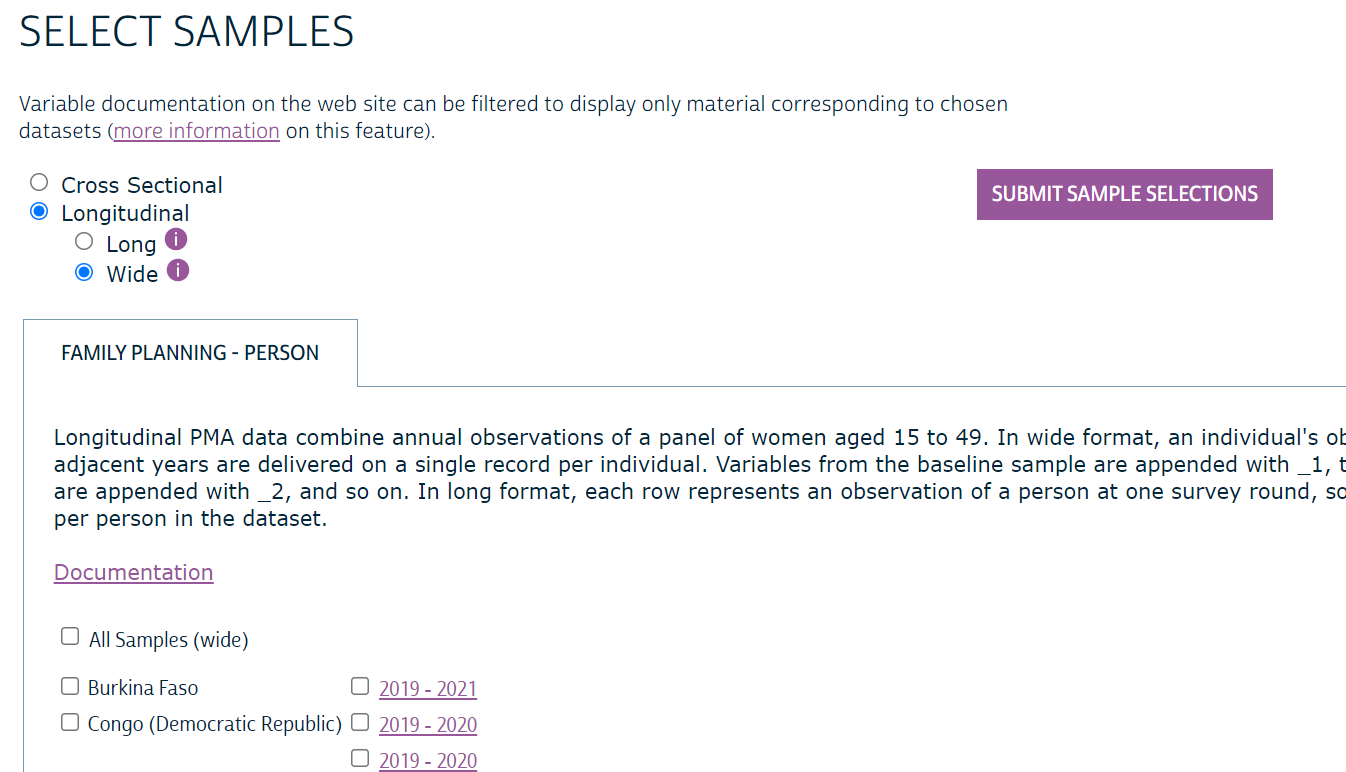
In addition to following up with the panel women over time, PMA also adjusted the sampling so that a cross-sectional sample could still be produced, enabling the calculation of an uninterrupted time series of representative indicators. Additional households were sampled to maintain national or regional representativeness if more than 10 percent of households left the sample after the first round.
Which weight to use: For analyses involving women from multiple phases of the longitudinal panel, see the weighting guide. For cross-sectional sub-samples, use FQWEIGHT.
Sample Composition of Cross-Sectional and Longitudinal Samples
Source: PMA Usernotes
For countries and years in which a longitudinal panel was conducted, there are cross-sectional and longitudinal versions of that survey that contain mostly the same individuals. Only households identified as the cross sectional sample in the original data are included in the cross sectional version of the sample (CROSS_SECTION). The longitudinal data files include all households and females interviewed in each Phase, but some panel women and households have been removed from the cross-sectional version of the data files in order to achieve a representative sample.
Household types (see HHTYPE), as identified in Phase 2 data:
- Phase 1 Dwellings (HHTYPE = 1): The physical dwelling place where a sampled household from Phase 1 resided. If at least one member of the Phase 1 household was still a resident (HHMEMPRESP), it was considered to be the same household in Phase 2. A Phase 1 dwelling could contain:
- Resident Phase 1 Member: A household member who was interviewed in Phase 1, and their information could be updated to correct errors (HHMEMUPDATE).
- Non-Resident Phase 1 Member: A person who was a member of the household in Phase 1 who is no longer a resident. The interviewer records why they are no longer residents (HHMEMSTAT).
- New Household Member: Someone who has become a member of the household between Phase 1 and Phase 2.
- New Household: If no Phase 1 household member was still a resident of the physical dwelling, this sampled dwelling now contains a new household, and the household roster is obtained for the new household members.
- Replacement Cross-Section Dwellings (HHTYPE = 2): In primary sampling units (EAID) where more than 10% of the sampled households were lost to follow-up, new households were sampled (see HHREPLACED).
- Panel Women Follow-Up Dwellings (HHTYPE = 3): If a panel woman moved between households within the study area, the interviewer collected information on the members of her new household. These households were not included in the cross-sectional sample.
The Phase 2 data also include women recruited for the panel who were not interviewed in Phase 1 if they aged into eligibility (age 15), if they moved into a sample household, or if they were a resident in a replacement cross-section dwelling (see HHREPLACED).
Female response types include:
- Cross-Section Only Women: Women who were not interviewed in Phase 1, but were given the baseline survey in Phase 2. They will be given a follow up survey in Phase 3.
- Aged in from Phase 1: was 14 in Phase 1 and is now at least 15 years old.
- At the end of the Phase 1 (baseline) interview, she expressed that she did not want to continue participation in the study, but was found in Phase 2, at which point she agreed to participate in the panel.
- A woman aged 15 to 49 living in a household selected for the cross-section.
- Cross-Section and Panel Women: Women aged 15 to 48 from Phase 1 who consented to follow-up and were found at Phase 2 in a cross-section dwelling. Women who were 49 years old in Phase 1 aged out of the panel, as they would have been 50 or older in Phase 2.
- Panel Only Women: Women aged 15 to 48 from Phase 1 who consented to follow-up and were found at Phase 2 in a dwelling not selected for the cross-section. Women who were 49 years old in Phase 1 aged out of the panel, as they would have been 50 or older in Phase 2.
PMA created a flow chart for each country to demonstrate the attrition rate of women and households.
- Burkina Faso
- Democratic Republic of the Congo - Kinshasa
- Democratic Republic of the Congo - Kongo Central
- Kenya
- Nigeria - Kano
- Nigeria - Lagos
Loss to Follow Up
Women could leave the panel if they or their entire household moved out of the primary sampling unit area (EA), moved to a household that was not sampled within the EA, aged out (turned 50 years old), did not consent to the follow-up survey, died, or could not be found. Women could enter the panel at Phase 2 if they were in a sampled household and turned 15 between Phase 1 and Phase 2, they moved into a sampled household, or their household was selected to be added to the panel to replace households lost from attrition. The following bullet points describe the scenarios in which a woman could be lost from the panel:
- Dwelling unit: The entire household moved out of the dwelling and no information could be found about whether they moved within or outside of the study area.
- Household: The woman could not be found due to an incomplete household questionnaire in Phase 2. This could be because the household respondent refused to participate or was unavailable, or the interview was only partially completed.
- Household roster: The woman was no longer a resident per the household roster because she had died, moved out of the study area, or her status was unknown.
- Female: The woman did not complete the Phase 2 interview because she refused to participate, she was unavailable, or for some other reason.
Household identifiers: Because households move between dwellings, disband, or change their composition, PMA constructed multiple household identifiers to retain as much information as possible.
- HHIDORIG: This string is generated by PMA to be a unique representation of a household at one point in time. This variable cannot be used to link households over time.
- HHID: This string is generated by IPUMS to be a unique representation of a household at one point in time. This variable cannot be used to link households over time.
- HHIDORIGP1: In Phase 2, this string represents the person's value of HHIDORIG from Phase 1, if they were enumerated in Phase 1. HHIDORIGP1 is the same as HHIDORIGP1DWELL if the individual lived in the same dwelling in both Phase 1 and Phase 2. If the person has moved to a different dwelling, HHIDORIGP1 in Phase 2 is the same as HHIDORIG in the Phase 1 data, allowing users to match the person to their household in Phase 1. In Phase 1, HHIDORIGP1 is the same as HHIDORIG.
- HHIDORIGP1DWELL: This string represents the physical dwelling the person occupied in Phase 1. HHIDORIGP1DWELL is the same as HHIDORIGP1 if the individual lived in the same dwelling in both Phase 1 and Phase 2.
Linked Service Delivery Point Files
PMA's sampling design for surveys conducted between 2013 and 2018 collect data from households and service delivery points from the same enumeration area (EAID, the primary sampling unit) for four rounds in a row before randomly selecting a new set of EAs. Often, the same facilities were sampled in multiple rounds. The variable FACILITYID identifies the facility within rounds that were conducted in the same set of EAs.
Beginning with the redesign in 2019, PMA refocused on longitudinal data collection with purposeful repeated interviews of the same facilities over time.
IPUMS has linked the SDP data using FACILITYID for rounds where the survey was conducted in the same set of EAs. Users should note that for a small number of matched cases (less than 4% of total cases), linked records of facilities had different EAID codes over time. Users should also expect a match rate of about 50% to 80% for most samples, especially those before the survey design explicitly returned to the same facilities for multiple survey rounds.
Supported By
![]()
![]()
![]()
![]()